Israel Tourism Statistics
Today we will do something different. Instead of visiting a site, we will dig into data and see what Israel tourism statistics we can find.
Note: the data sources are Tourism and Hotel Services Statistics, published quarterly by the Israeli CBS (Central Bureau of Statistics), and Research and Statistics by the Ministry of Tourism.
Table of Contents
How big is the tourism sector?
What is the contribution of travel and tourism to GDP as a share of GDP (%)? According to the January 2020 report by the Ministry of Tourism, the tourism industry is estimated at 6.2% of GDP.
Is 6.2% a big or a small number? In the following map by Knoema, you can hover over countries and the contribution of travel and tourism to GDP as a share of GDP (%). And Israel is behind the USA and most of Europe.
How many tourists visited Israel in 2019?
According to CBS, 4.55 million tourists visited Israel in 2019.
Who visits Israel?
And now, let’s see a division by country of citizenship. Here are the top 15 countries.
| Country of citizenship | Tourists (January-December 2019) in absolute numbers (thousands) | ||
|---|---|---|---|
| Couttry | By land | By air | Total |
| United States | 98.4 | 871.0 | 969.4 |
| France | 16.2 | 351.3 | 367.5 |
| Russian Federation | 10.0 | 308.1 | 318.1 |
| Germany | 10.0 | 267.4 | 289.0 |
| United Kingdom | 12.0 | 223.4 | 235.4 |
| Italy | 20.9 | 169.8 | 190.7 |
| Poland | 14.8 | 142.1 | 156.9 |
| China | 46.2 | 110.0 | 156.1 |
| Ukraine | 9.4 | 126.0 | 135.4 |
| Romania | 14.2 | 106.9 | 121.1 |
| Spain | 16.7 | 87.9 | 104.7 |
| Canada | 14.6 | 81.2 | 95.8 |
| Netherlands | 6.9 | 84.0 | 91.0 |
| Brazil | 17.3 | 64.8 | 82.1 |
| India | 37.6 | 27.5 | 65.1 |
| Grand total | 583.4 | 3,968.2 | 4,551.6 |
Most tourists that visit Israel come from the United States and Europe.
How long is the average visit to Israel?
The average length of stay for all tourists was 10.0 nights, and for
tourists staying in Israel up to 30 days – 8.2 nights.
The duration of the visit depends on the purpose of the visit. And as you can see from the following quote, there are different categories of travelers.
24.3% of the tourists arrived for religious purposes (pilgrimage),
21.3% came for touring and sightseeing, 30.0% for visiting friends and
relatives, 10.3% for leisure and pleasure, 8.9% for business and
missions, and 5.2% specified “other” as the main purpose of their visit.
Tourist expenditure

As you can see from the table above, the accommodation has the most significant influence on the budget. And this leads us to the next section.
Accommodation
Type
Most tourists stay in hotels or holiday resorts. Here is a pie chart that represents the data.

Level of accommodation
11.4% of the tourists stayed in high-end accommodation, 86.4%
reported a medium accommodation level, 1.0% reported a low
accommodation level and 1.2% reported “other” when asked about the
level of accommodation used on their visit.
Cost of Rooms
Both tourists and Israeli complain about the high prices of accommodations in Israel. So let’s look at table 19 (ROOMS, BEDS, PERSON-NIGHTS, BED OCCUPANCY, REVENUE, AND JOBS IN HOTEL SERVICES(1)), and see what we can deduct from it.
| Revenue(3) | Person-nights | ||||||||
|---|---|---|---|---|---|---|---|---|---|
| Jobs (4) | From Israelis | From Tourists | Total | Bed occupancy | Israelis (3) | Tourists (3) | Total | Month | Year |
| Thousands | NIS million | % | Thousands | ||||||
| 37.0 | 5,462.5 | 4,037.2 | 9,499.7 | 48.7 | 15,915.6 | 11,291.6 | 27,207.0 | 2010 | |
| 38.3 | 5,693.0 | 4,052.8 | 9,745.9 | 48.1 | 15,852.6 | 11,388.3 | 27,240.7 | 2011 | |
| 38.3 | 6,052.2 | 4,331.7 | 10,383.9 | 48.5 | 16,253.8 | 11,247.2 | 27,500.9 | 2012 | |
| 39.0 | 6,255.1 | 4,336.9 | 10,592.0 | 48.9 | 16,451.7 | 11,485.4 | 27,937.1 | 2013 | |
| 40.1 | 6,381.1 | 4,194.5 | 10,575.7 | 47.3 | 16,452.8 | 10,966.9 | 27,419.4 | 2014 | |
| 41.4 | 6,935.8 | 4,185.6 | 11,121.2 | 46.7 | 17,065.8 | 9,972.4 | 27,038.2 | 2015 | |
| 41.5 | 7,130.4 | 4,240.0 | 11,370.3 | 47.2 | 17,315.4 | 10,411.9 | 27,727.4 | 2016 | |
| 45.2 | 7,380.1 | 5,004.2 | 12,384.2 | 49.8 | 17,263.7 | 12,939.5 | 30,201.7 | 2017 | |
| 45.0 | 7,662.8 | 5,625.7 | 13,288.5 | 49.5 | 17,105.3 | 13,862.1 | 30,967.3 | 2018 | |
| 46.5 | 8,001.2 | 5,976.9 | 13,978.0 | 50.3 | 17,340.5 | 14,420.1 | 31,759.6 | 2019 | |
| 41.2 | 451.2 | 354.2 | 805.5 | 37.6 | 1,025.4 | 953.1 | 1,978.5 | I | 2019 |
| 41.6 | 437.4 | 364.4 | 801.8 | 42.9 | 1,018.0 | 1,028.4 | 2,046.4 | II | |
| 44.0 | 510.0 | 554.1 | 1,064.1 | 48.8 | 1,143.7 | 1,435.4 | 2,579.1 | III | |
| 48.1 | 744.5 | 583.3 | 1,327.8 | 54.0 | 1,552.8 | 1,246.6 | 2,799.4 | IV | |
| 47.6 | 613.5 | 618.0 | 1,231.5 | 52.0 | 1,359.7 | 1,439.5 | 2,799.3 | V | |
| 48.2 | 732.3 | 561.7 | 1,293.9 | 53.2 | 1,573.7 | 1,206.7 | 2,780.4 | VI | |
| 49.1 | 881.7 | 443.6 | 1,325.3 | 58.6 | 2,030.4 | 1,130.5 | 3,161.0 | VII | |
| 49.7 | 1,039.3 | 404.2 | 1,443.4 | 62.1 | 2,334.3 | 1,016.4 | 3,349.7 | VIII | |
| 48.7 | 701.2 | 481.7 | 1,182.9 | 50.7 | 1,481.5 | 1,157.8 | 2,639.2 | IX | |
| 47.8 | 735.0 | 584.1 | 1,319.1 | 50.1 | 1,419.7 | 1,299.7 | 2,719.4 | X | |
| 46.7 | 553.5 | 619.1 | 1,172.5 | 50.6 | 1,139.2 | 1,490.8 | 2,629.9 | XI | |
| 45.5 | 601.7 | 408.4 | 1,010.1 | 42.5 | 1,262.1 | 1,015.1 | 2,277.3 | XII | |
Notes:
- (3) Incl. estimates of components of Hotel Services for which data were not collected.
- (4) Incl. jobs of Man-Power companies.
The first thing that we can see from the table above is bed occupancy. Looking at the 2019 division by month, we see that winter month has the lowest occupancy rates. And the summer vacation month has the highest rates.
And if we take this data and calculate the revenue divided by person nights, we will get the following table.
| Year | Month | Revenue from Israelis/Israelis Person nights | Revenue from Tourists/Tourists Person nights | Total Revenue/Total Person nights |
|---|---|---|---|---|
| 2010 | 343.2 | 357.5 | 349.2 | |
| 2011 | 359.1 | 355.9 | 357.8 | |
| 2012 | 372.4 | 385.1 | 377.6 | |
| 2013 | 380.2 | 377.6 | 379.1 | |
| 2014 | 387.8 | 382.5 | 385.7 | |
| 2015 | 406.4 | 419.7 | 411.3 | |
| 2016 | 411.8 | 407.2 | 410.1 | |
| 2017 | 427.5 | 386.7 | 410.0 | |
| 2018 | 448.0 | 405.8 | 429.1 | |
| 2019 | 461.4 | 414.5 | 440.1 | |
| 2019 | I | 440.0 | 371.6 | 407.1 |
| II | 429.7 | 354.3 | 391.8 | |
| III | 445.9 | 386.0 | 412.6 | |
| IV | 479.5 | 467.9 | 474.3 | |
| V | 451.2 | 429.3 | 439.9 | |
| VI | 465.3 | 465.5 | 465.4 | |
| VII | 434.2 | 392.4 | 419.3 | |
| VIII | 445.2 | 397.7 | 430.9 | |
| IX | 473.3 | 416.0 | 448.2 | |
| X | 517.7 | 449.4 | 485.1 | |
| XI | 485.9 | 415.3 | 445.8 | |
| XII | 476.7 | 402.3 | 443.6 |
The first thing we can see is that Israeli and tourists pay approximately the same prices. And if we look at the 2019 month division, we can see that February was the cheapest month. April and October were the most expensive months. Probably because these are holiday months (April – Passover, October – Sukkot).
And now let’s look at the prices. Total revenue divided by Total Person nights for 2019 was 440.1. If we assume that the income of hotels is only from renting rooms, then the last column represents the average price per person per night. Meaning the average double room will cost about 880 NIS per night. That is quite expensive compared to most European countries and the USA.
Attractions
When I wrote Israel Trip Planner, I also compiled a list of top attractions. That list was based on various websites, which include user feedback. And now, let’s see the most popular sites according to the Ministry of Tourism and CBS.
According to the Ministry of Tourism, the most visited regions in 2018 were Jerusalem, Tel Aviv-Jaffa, and Dead Sea Area.
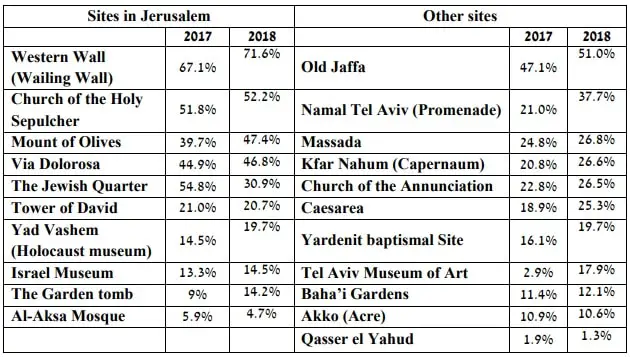
On the CBS site, I also found table 64 – visits in Israel nature and parks authority sites, by type of site and district. Let’s start with the raw data, and then I will present several derivatives.
Note: the numbers in the table are in thousands.
| Israelis | Tourists | Total | |||||||||
|---|---|---|---|---|---|---|---|---|---|---|---|
| 2019 | 2018 | 2017 | 2019 | 2018 | 2017 | 2019 | 2018 | 2017 | |||
| Grand total | 9,110.1 | 8,686.2 | 8,499.6 | 3,769.8 | 3,379.7 | 2,758.7 | 12,880.0 | 12,065.8 | 11,258.2 | ||
| 1. | Recriation sites – total | 6,505.2 | 6,126.4 | 6,003.9 | 1,034.7 | 960.1 | 807.9 | 7,539.9 | 7,086.5 | 6,811.8 | |
| 1.1 | Jerusalem District(1) – total | 633.8 | 576.0 | 557.6 | 13.3 | 12.7 | 11.4 | 647.1 | 588.6 | 569.0 | |
| Me’arat Avshalom (stalactives cave) | 220.2 | 204.7 | 209.0 | 6.3 | 5.5 | 3.5 | 226.5 | 210.3 | 212.5 | ||
| En Hemed | 119.2 | 112.7 | 85.2 | 0.6 | 1.3 | 1.2 | 119.8 | 114.0 | 86.4 | ||
| Eynot Zukim (En Feshcha) | 149.4 | 139.6 | 147.3 | 3.4 | 3.4 | 3.7 | 152.7 | 143.0 | 150.9 | ||
| En Prat | 145.0 | 118.9 | 116.0 | 2.9 | 2.5 | 3.2 | 147.9 | 121.3 | 119.2 | ||
| 1.2 | Northern District – total | 2,413.9 | 2,006.2 | 2,107.5 | 633.7 | 611.0 | 528.1 | 3,047.6 | 2,617.2 | 2,635.5 | |
| Gamla | 70.1 | 59.1 | 58.2 | 19.9 | 20.1 | 17.9 | 90.0 | 79.2 | 76.1 | ||
| Tel Dan | 222.4 | 167.1 | 185.1 | 152.5 | 137.2 | 114.7 | 374.9 | 304.2 | 299.8 | ||
| Ha Tanur (Nahal Ayun) | 180.7 | 105.6 | 105.4 | 0.6 | 0.8 | 0.9 | 181.4 | 106.4 | 106.4 | ||
| Ha Hula | 88.8 | 82.9 | 91.4 | 7.5 | 7.3 | 7.2 | 96.3 | 90.2 | 98.6 | ||
| Ma’ayanot HaBanyas (Springs) | 371.4 | 276.6 | 287.8 | 326.1 | 324.1 | 282.3 | 697.5 | 600.7 | 570.0 | ||
| En Afeq | 144.6 | 136.9 | 130.2 | 0.1 | 0.0 | 0.1 | 144.7 | 137.0 | 130.3 | ||
| Yehudiyya | 86.6 | 78.5 | 89.0 | 3.1 | 4.0 | 7.9 | 89.8 | 82.5 | 96.9 | ||
| Brichat HaMeshushim | 34.7 | 28.8 | 48.1 | 1.7 | 1.8 | 2.3 | 36.4 | 30.6 | 50.4 | ||
| Hurshat Tal(2) | 166.3 | 136.0 | 152.5 | 0.3 | 0.3 | 0.4 | 166.6 | 136.3 | 152.8 | ||
| Akhziv | 114.9 | 110.8 | 93.6 | 0.3 | 0.2 | 0.2 | 115.1 | 110.9 | 93.8 | ||
| Gan HaShlosha (Sakhne) | 345.4 | 299.2 | 357.3 | 21.8 | 21.7 | 16.2 | 367.2 | 320.9 | 373.5 | ||
| Ma’yan Harod | 148.2 | 122.1 | 112.7 | 33.5 | 31.9 | 23.2 | 181.8 | 154.0 | 135.9 | ||
| Nahal Amud | 104.0 | 90.5 | 90.9 | 0.7 | 0.4 | 1.0 | 104.6 | 90.9 | 91.8 | ||
| Nahal Shnir (Hazbany) | 247.3 | 220.9 | 209.2 | 3.2 | 1.8 | 3.9 | 250.6 | 222.7 | 213.1 | ||
| Arbel | 88.6 | 91.2 | 96.1 | 62.3 | 59.3 | 50.1 | 150.9 | 150.6 | 146.1 | ||
| 1.3 | Haifa District – total | 318.1 | 352.5 | 320.9 | 1.9 | 1.5 | 1.1 | 320.0 | 354.0 | 321.9 | |
| Dor HaBonim Beach | 180.9 | 192.6 | 171.1 | 0.1 | 0.1 | 0.0 | 181.1 | 192.7 | 171.1 | ||
| Nahal HaMe’arot and Hay-Bar | |||||||||||
| Karmel (Wildlife Center) – total | 120.9 | 117.6 | 117.0 | 1.8 | 1.4 | 1.0 | 122.6 | 119.0 | 118.0 | ||
| Karmel | 16.3 | 42.3 | 32.8 | .. | .. | 0.0 | 16.3 | 42.3 | 32.8 | ||
| 1.4 | Central District – total | 1,877.4 | 1,946.5 | 1,706.0 | 1.3 | 0.9 | 0.7 | 1,878.6 | 1,947.4 | 1,706.7 | |
| Bet Yannay Beach | 2.2 | 25.2 | 74.0 | .. | .. | .. | 2.2 | 25.2 | 74.0 | ||
| Yarqon Origins(3) | 372.2 | 365.5 | 333.3 | 1.0 | 0.8 | 0.5 | 373.3 | 366.3 | 333.9 | ||
| Nahal Taninim | 67.5 | 51.6 | 53.6 | 0.3 | 0.2 | 0.1 | 67.8 | 51.7 | 53.8 | ||
| Palmahim | 1,435.4 | 1,504.1 | 1,245.0 | .. | .. | .. | 1,435.4 | 1,504.1 | 1,245.0 | ||
| 1.5 | Southern District – total | 1,262.0 | 1,245.3 | 1,312.0 | 384.5 | 334.1 | 266.7 | 1,646.6 | 1,579.4 | 1,578.7 | |
| Eshkol (Park) | 119.7 | 103.3 | 134.5 | 0.1 | 0.1 | 0.3 | 119.8 | 103.5 | 134.8 | ||
| National Park Ashkelon | 433.7 | 495.5 | 483.8 | 4.7 | 4.6 | 4.5 | 438.4 | 500.1 | 488.3 | ||
| En Gedi(4) | 388.4 | 357.3 | 403.9 | 316.7 | 261.1 | 203.3 | 705.1 | 618.4 | 607.2 | ||
| Arad Visitors Center | .. | .. | .. | .. | .. | .. | .. | .. | .. | ||
| Mizpe Ramon Visitors Center | 109.2 | 105.0 | 103.1 | 17.9 | 19.8 | 18.0 | 127.1 | 124.8 | 121.1 | ||
| Hay-Ramon (Wildlife Center) | 19.9 | 16.5 | 19.4 | 1.2 | 1.8 | 1.8 | 21.2 | 18.3 | 21.2 | ||
| Be’erot Campground | 35.9 | 33.0 | 32.9 | .. | .. | .. | 35.9 | 33.0 | 32.9 | ||
| Almuggim | 117.7 | 104.5 | 103.7 | 40.6 | 43.8 | 36.2 | 158.3 | 148.3 | 139.9 | ||
| Beasts of Prey Center Yotvata | 37.5 | 30.1 | 30.7 | 3.3 | 2.8 | 2.6 | 40.8 | 33.0 | 33.3 | ||
| 2. | Historical sites – total | 2,604.9 | 2,559.9 | 2,495.6 | 2,735.1 | 2,419.5 | 1,950.8 | 5,340.0 | 4,979.3 | 4,446.4 | |
| 2.1 | Jerusalem District(1) – total | 512.2 | 596.1 | 423.5 | 530.2 | 498.8 | 383.2 | 1,042.5 | 1,094.9 | 806.7 | |
| Mount Gerizim | 12.4 | 11.4 | 8.0 | 15.1 | 11.0 | 7.5 | 27.5 | 22.4 | 15.6 | ||
| Qastel | 66.9 | 78.4 | 64.7 | 1.7 | 1.3 | 1.2 | 68.6 | 79.7 | 65.9 | ||
| Old City Walls | 366.6 | 438.7 | 275.4 | 6.7 | 7.6 | 6.6 | 373.3 | 446.3 | 282.0 | ||
| Herodion | 38.5 | 40.1 | 44.0 | 59.5 | 59.0 | 44.1 | 97.9 | 99.1 | 88.1 | ||
| Qumeran | 27.9 | 27.5 | 31.4 | 447.3 | 419.9 | 323.7 | 475.2 | 447.4 | 355.1 | ||
| 2.2 | Northern District – total | 718.8 | 652.2 | 692.4 | 589.2 | 543.9 | 461.7 | 1,308.0 | 1,196.1 | 1,154.1 | |
| Bet Alfa | 12.5 | 13.1 | 13.6 | 19.3 | 20.9 | 20.1 | 31.8 | 34.0 | 33.7 | ||
| Bet She’an | 70.7 | 69.1 | 76.0 | 172.3 | 153.3 | 126.8 | 243.0 | 222.4 | 202.8 | ||
| Bet She’arim | 58.0 | 51.4 | 59.8 | 8.7 | 7.3 | 6.3 | 66.8 | 58.7 | 66.1 | ||
| Bar’am | 16.0 | 16.6 | 16.7 | 2.9 | 1.6 | 0.9 | 18.9 | 18.2 | 17.7 | ||
| Mishmar HaKarmel Ranch | 25.0 | 27.6 | 24.2 | .. | .. | .. | 25.0 | 27.6 | 24.2 | ||
| Hamat Teverya | 24.3 | 13.4 | 9.6 | 5.6 | 4.2 | 3.7 | 29.9 | 17.6 | 13.3 | ||
| Hazor | 14.5 | 11.6 | 6.7 | 21.0 | 17.7 | 17.1 | 35.5 | 29.3 | 23.7 | ||
| Yehi’am | 44.0 | 41.8 | 39.7 | 1.0 | 1.4 | 0.8 | 45.0 | 43.2 | 40.5 | ||
| Kokhav HaYarden | 48.3 | 40.3 | 31.0 | 7.5 | 9.7 | 11.9 | 55.8 | 50.0 | 42.9 | ||
| Korazim | 16.9 | 13.0 | 11.4 | 47.2 | 42.1 | 37.1 | 64.1 | 55.1 | 48.5 | ||
| Kursi | 10.7 | 8.5 | 8.9 | 35.2 | 35.7 | 33.3 | 45.9 | 44.2 | 42.2 | ||
| Nimrod Fortress | 56.6 | 47.8 | 52.3 | 15.8 | 14.9 | 13.7 | 72.4 | 62.7 | 66.0 | ||
| Megiddo | 27.2 | 27.2 | 29.7 | 186.7 | 172.5 | 134.3 | 213.9 | 199.7 | 164.1 | ||
| Majrasa-Batiha | 207.0 | 184.8 | 237.8 | 11.3 | 13.8 | 14.4 | 218.3 | 198.6 | 252.2 | ||
| Zippori | 87.0 | 85.9 | 75.1 | 54.7 | 48.8 | 41.4 | 141.7 | 134.7 | 116.5 | ||
| 2.3 | Haifa District – total | 466.6 | 466.1 | 450.7 | 571.8 | 498.3 | 409.1 | 1,038.4 | 964.4 | 859.8 | |
| Qesariyya | 466.6 | 466.1 | 450.7 | 571.8 | 498.2 | 409.1 | 1,038.4 | 964.4 | 859.8 | ||
| 2.4 | Central District – total | 94.4 | 83.6 | 68.2 | 2.7 | 2.6 | 2.0 | 97.1 | 86.2 | 70.2 | |
| Apollonia | 94.4 | 83.6 | 68.2 | 2.7 | 2.6 | 2.0 | 97.1 | 86.2 | 70.2 | ||
| 2.5 | Southern District – total | 812.9 | 761.8 | 860.9 | 1,041.2 | 876.0 | 694.7 | 1,854.1 | 1,637.7 | 1,555.7 | |
| Bet Guvrin | 221.2 | 187.7 | 196.2 | 36.4 | 37.1 | 35.7 | 257.6 | 224.8 | 231.8 | ||
| Mamshit | 55.2 | 52.5 | 58.5 | 3.4 | 4.2 | 4.4 | 58.6 | 56.7 | 62.9 | ||
| The Good Samaritan | 18.7 | 18.0 | 16.6 | 11.5 | 11.1 | 8.1 | 30.2 | 29.1 | 24.7 | ||
| Massadah(5) | 301.1 | 295.7 | 362.3 | 864.1 | 697.8 | 529.6 | 1,165.2 | 993.5 | 891.9 | ||
| Ovdat | 23.0 | 22.4 | 23.9 | 25.5 | 23.5 | 19.9 | 48.4 | 46.0 | 43.8 | ||
| En Ovdat(6) | 136.3 | 129.8 | 143.4 | 52.4 | 53.5 | 47.8 | 188.6 | 183.3 | 191.2 | ||
| Tel Be’er Sheva | 26.5 | 27.4 | 28.3 | 34.4 | 36.9 | 36.8 | 60.9 | 64.3 | 65.1 | ||
| Tel Arad | 31.1 | 28.3 | 31.7 | 13.5 | 11.7 | 12.5 | 44.5 | 40.0 | 44.2 | ||
What are the most popular Israel nature and parks authority sites? From the table above, we can get a list of the most popular places for tourists and Israelis.
Note: check out National Parks And Nature Reserves in Israel, where I cover all of them and discuss subscriptions and combo tickets.
Here are the top 20 National Parks that Israeli love:
| Site Name | Israelis – 2019 |
|---|---|
| Palmahim | 1,435.4 |
| Qesariyya | 466.6 |
| National Park Ashkelon | 433.7 |
| En Gedi(4) | 388.4 |
| Yarqon Origins(3) | 372.2 |
| Ma’ayanot HaBanyas (Springs) | 371.4 |
| Old City Walls | 366.6 |
| Gan HaShlosha (Sakhne) | 345.4 |
| Massadah(5) | 301.1 |
| Nahal Shnir (Hazbany) | 247.3 |
| Tel Dan | 222.4 |
| Bet Guvrin | 221.2 |
| Me’arat Avshalom (stalactites cave) | 220.2 |
| Majrasa-Batiha | 207.0 |
| Dor HaBonim Beach | 180.9 |
| Ha Tanur (Nahal Ayun) | 180.7 |
| Hurshat Tal(2) | 166.3 |
| Eynot Zukim (En Feshcha) | 149.4 |
| Ma’yan Harod | 148.2 |
| En Prat | 145.0 |
And here are the top 20 National Parks that tourists love:
| Site Name | Tourists – 2019 |
|---|---|
| Massadah(5) | 864.1 |
| Qesariyya | 571.8 |
| Qumeran | 447.3 |
| Ma’ayanot HaBanyas (Springs) | 326.1 |
| En Gedi(4) | 316.7 |
| Megiddo | 186.7 |
| Bet She’an | 172.3 |
| Tel Dan | 152.5 |
| Arbel | 62.3 |
| Herodion | 59.5 |
| Zippori | 54.7 |
| En Ovdat(6) | 52.4 |
| Korazim | 47.2 |
| Coral beach | 40.6 |
| Bet Guvrin | 36.4 |
| Kursi | 35.2 |
| Tel Beer Sheva | 34.4 |
| Ma’yan Harod | 33.5 |
| Ovdat | 25.5 |
| Gan HaShlosha (Sakhne) | 21.8 |
Notes:
- (2) Including The Tal Campground.
- (3) Including Afeq Park.
- (4) Including Nahal David, Nahal Arugot, and En Gedi Archeological Site.
- (5) Including Massadah and Massadah National Park Western Approach.
- (6) Including Zinnim Cliff.
As I saw in other statistical data (that is not presented in this post), Israeli prefer mostly recreational sites. Many of them are beaches, and most of them are suitable for hot weather (either water or caves). And tourists prefer historical sites.
Satisfaction with the visit to Israel
I want to end this post on a positive note by answering whether you should visit Israel.
Tourists were asked to rate their satisfaction with three aspects of their visit to Israel, on a scale of 1 to 5 (1 indicating a low level of satisfaction and 5 indicating a high level of comfort).
93.3% of the tourists rated their visit as generally “very good” or “excellent.”
The average level of tourist satisfaction was 4.3.
And the best sign for satisfied tourists is returning tourists.
54.2% of the tourists visited Israel for the first time, while 45.8% had already visited Israel. Among the latter category (N=8,268), approximately 77.4% had either made their previous visit to Israel up to two years before the current visit.
Others would say that returning tourists is a sign that 8.2 nights is not enough to get familiar with Israel. And I agree.
What was the most interesting Israel tourism statistic? What did you already know, and what surprised you? Tell us in the comments below.
That’s all for today, and I’ll see you in future travels!
Stay Tuned!
Additional Resources
Here are several resources that I created to help travelers:- Trip Planner with Attractions and Itineraries is the page that will help you create your perfect travel route.
- What is the Best Time to visit Israel? To answer this question, we will consider the weather, prices, holidays, festivals, and more.
- Information and Tips for Tourists to Israel will answer the most common questions tourists have about Israel (including safety, passports, weather, currency, tipping, electricity, and much more).
- Israel National Parks and Nature Reserves include a complete list, top ten, map, tickets (Israel Pass, Matmon, combo), and campsites.
- If you are looking for things to do, here are the pages for Jerusalem, Tel Aviv, Haifa, Sea Of Galilee, Akko (Acre), Eilat, Nazareth, Safed (Tzfat), and Makhtesh Ramon.




Hi I have a research paper in geography on the subject of economics- Tourism in Israel
I would be happy if I could ask you some questions
Thanks in advance!
Hi,
You can contact me at- hi@israel-in-photos.com